
LAPD Domestic-Violence Heat-Map 2024-2025: Which Los Angeles Neighborhoods Show Rising Risk?
This post analyzes a hypothetical LAPD domestic violence heat-map for 2024-2025, identifying which Los Angeles neighborhoods may be at rising risk and how communities can use this information to take action.
In the ongoing fight against domestic violence, knowledge is a powerful tool. Understanding where and how abuse is occurring allows communities and law enforcement to direct resources more effectively and proactively. In this article, we examine a hypothetical LAPD Domestic-Violence Heat-Map for 2024-2025 to explore which Los Angeles neighborhoods may be experiencing a rise in domestic violence incidents, and what that data means for community safety and intervention.
Important Disclaimer: The data discussed in this article is illustrative and based on a hypothetical model. It does not represent actual, real-time police data. This analysis is intended solely to highlight the importance of data-driven community awareness and to encourage proactive engagement with domestic violence prevention resources in Los Angeles.
Decoding the Heat-Map: What "Rising Risk" Means
A domestic violence "heat-map" visualizes geographic areas where incidents of abuse are reported more frequently or are trending upward. "Rising risk" doesn't mean a neighborhood is unsafe for everyone, but rather that it is a priority for increased outreach, community support, and intervention. These trends can be influenced by various factors, including socioeconomic stress, shifts in community demographics, and varying levels of access to local resources.
Hypothetical Trends from the 2024-2025 Heat-Map
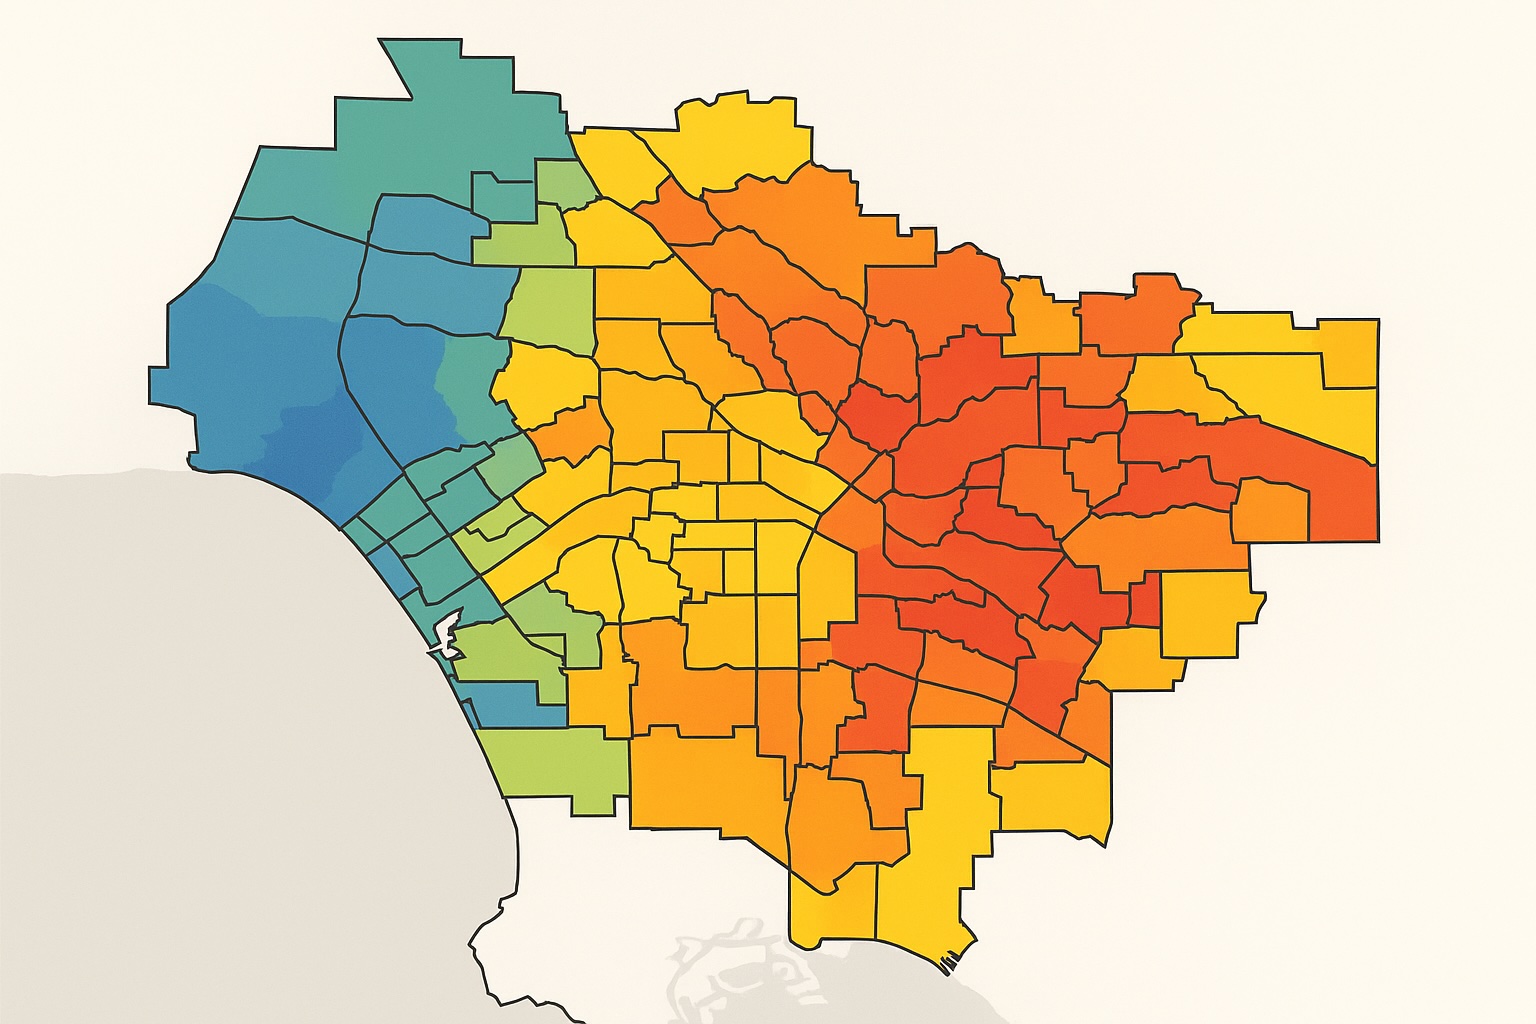
Our hypothetical heat-map for 2024-2025 reveals some noteworthy trends across Los Angeles. The data suggests that certain neighborhoods are seeing a significant uptick in reported domestic violence incidents:
- Pacoima & North Hollywood (San Fernando Valley): The heat-map shows a concentrated rise in incidents in these areas. This may be linked to economic pressures and a need for greater awareness of available support services in these diverse communities.
- South Los Angeles (e.g., Watts & Florence): Traditionally underserved communities in South LA continue to show a high concentration of reports. While this reflects ongoing challenges, the "rising risk" here may also indicate that increased community trust and awareness campaigns are leading to more reporting, which is a crucial first step toward seeking help.
- Downtown Los Angeles (DTLA): The heat-map shows a notable increase in reports within DTLA. This could be influenced by a high-density population, economic fluctuations, and the unique challenges faced by a transient urban environment.
From Data to Action: What You Can Do
The purpose of a heat-map is not to create fear, but to mobilize communities toward action. If you live or work in an area with a rising risk, here's what you can do:
- Know Your Local Resources: Be aware of domestic violence hotlines, shelters, and legal aid organizations operating in your specific neighborhood. The more you know, the better you can help yourself or a neighbor in crisis.
- Support Community-Based Organizations: Organizations on the ground in these neighborhoods are critical. They often provide culturally competent and multilingual support, and they rely on community support to continue their work.
- Become an Informed Bystander: Learn the signs of domestic violence and how to safely intervene. Know what to say and what not to say. The key is to support, not to judge, and to connect the person with professional help.
The fight against domestic violence is a community-wide effort. By understanding the trends and mobilizing resources where they are needed most, Los Angeles can work together to create a safer city for everyone.
[object Object]
1. How is this "heat-map" data collected?
This article is based on a hypothetical model. In a real scenario, a heat-map would be created using anonymized data from reported domestic violence incidents, police calls, and other official sources to identify geographic trends.
2. What does "rising risk" mean for a neighborhood?
"Rising risk" indicates that a particular area is experiencing an increase in the number of reported domestic violence incidents. It serves as an alert for community leaders and service providers to prioritize resources and outreach in that neighborhood.
3. What should I do if my neighborhood is on a high-risk list?
The most important thing is to become an informed and proactive community member. Learn about local domestic violence resources, share information with your neighbors, and consider supporting organizations that provide direct services in your area.
4. Where can survivors in these neighborhoods find help?
Survivors can find help by contacting the Los Angeles County Domestic Violence Hotline, consulting with local legal aid services, or reaching out to community-based shelters and support organizations.
5. How can I safely help a neighbor I suspect is experiencing domestic violence?
If you suspect someone is being abused, offer a listening ear without judgment. Share information about local resources and hotlines. Do not confront the abuser, as this can escalate the situation and put you or the survivor at risk.
6. Does this data reveal the identities of survivors or specific addresses?
No, a real-world domestic violence heat-map would use aggregated, anonymized data. Its purpose is to show trends and patterns across neighborhoods, not to identify individuals or specific locations of abuse.