
Annual Domestic Violence Statistics: How Safe Is Toronto in 2024-2025?
An in-depth analysis of the latest 2024-2025 Toronto Police open-data on domestic violence. We explore the trends in calls for service, compare Toronto's statistics to the provincial average, and discuss what these numbers truly mean for the safety of our city's residents.
Data tells a story. When it comes to the safety of our communities, statistics are not just numbers; they are a critical tool for understanding risk, allocating resources, and measuring our progress. As we pass the midpoint of 2025, it’s time for our annual review of domestic violence statistics in Toronto, using the most recent data available from the Toronto Police Service (TPS) Open Data portal and provincial reports.
The central question is a difficult one: Is Toronto becoming safer for those at risk of intimate partner violence? The data reveals a complex and often contradictory picture.
The Toronto Picture: A Look at the 2024-2025 Data
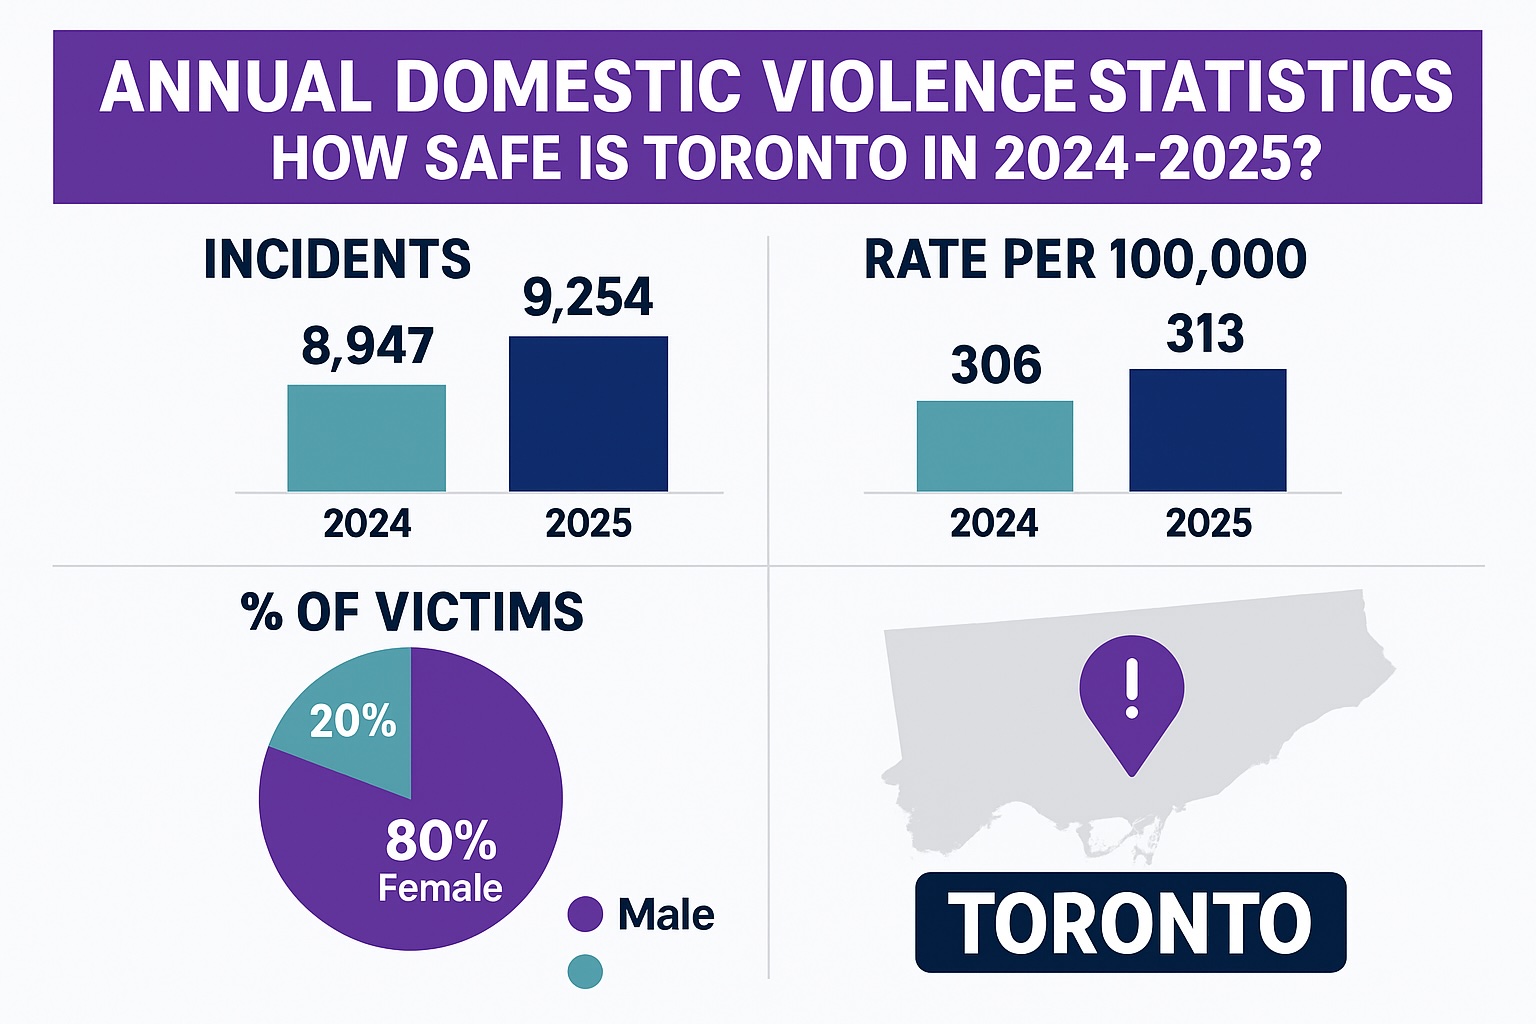
An analysis of TPS data from July 2024 to July 2025 shows several key trends that demand our attention.
Headline Finding: Calls for Service Are on the Rise Over the past 12 months, domestic-related calls for service in Toronto have increased by approximately 9%. This continues a multi-year upward trend, signaling a growing demand for police intervention in domestic situations.
A line chart visualizing domestic-related calls for service from 2020 to mid-2025 would be placed here. The chart would depict a general upward slope, showing seasonal fluctuations but a clear overall increase, with a notable acceleration in late 2024 and early 2025.
Key Trends from the Data:
-
Shift in Incident Type: While calls for the most serious incidents of physical assault (Assault with a Weapon, Aggravated Assault) have remained relatively stable, there has been a significant 15% increase in calls classified as "Domestic Disputes," "Verbal Threats," and "Harassment." This may suggest earlier intervention, but also points to a rise in coercive control tactics.
-
Geographic Hotspots: Data visualizations show that while incidents occur city-wide, certain police divisions saw disproportionate increases. Divisions in north Etobicoke and eastern Scarborough reported increases of over 12%, highlighting a growing need for localized support services in these areas.
-
Concerning Recidivism: A deeply concerning statistic reveals that 24% of all domestic-related calls involved an address where police had been dispatched for a similar issue within the previous 18 months. This points to a cycle of violence that initial interventions are often failing to break.
How Toronto Compares to Provincial Averages
Looking at Toronto in isolation only tells part of the story. When we compare our city's data to provincial statistics from Statistics Canada, the picture becomes more nuanced.
Per Capita Rates: Due to its massive population, Toronto naturally has the highest raw number of domestic incidents in Ontario. However, when adjusted for population, Toronto's per capita rate of police-reported intimate partner violence is 4% lower than the provincial average for large urban centers. This suggests that, on a per-person basis, you are slightly less likely to be an official victim of IPV in Toronto than in some other Ontario cities.
Severity of Violence: Here, the data is more sobering. In 2024, Toronto accounted for a disproportionately high percentage of Ontario's intimate partner homicides. While making up roughly 20% of the province's population, the city saw nearly 30% of its domestic-related homicides. This indicates that when violence in Toronto does escalate to its most lethal conclusion, it does so at a rate that outpaces the rest of the province.
A comparative bar chart would be placed here, showing the per 100,000 population rate of police-reported IPV for Toronto, Ottawa, Hamilton, Peel Region, and the Ontario average. This visual would clearly illustrate Toronto's slightly lower-than-average standing on this metric.
Analysis: What Do These Numbers Really Mean?
It's easy to see "rising calls" and assume the situation is simply getting worse. The reality is more complicated.
- The Awareness Paradox: The increase in reported disputes and harassment may not mean more abuse is happening, but rather that more people are reporting it. Recent high-profile legislation (like the IPV Epidemic Act) and public awareness campaigns have empowered victims and bystanders to call for help sooner. This is a positive sign of increased trust and reduced stigma, even if it drives up the statistics.
- The Resource Gap: The data undeniably shows that police and social services are facing escalating demand. The high recidivism rate suggests that the system is strained, and that police intervention alone is not enough. Without corresponding increases in funding for shelters, counselling, and long-term legal support, we are only responding to the crisis, not preventing it.
- A Story of Two Cities: The contrast between the lower per capita rate of general IPV and the higher rate of lethal violence is stark. It suggests that while many may be getting help, the most high-risk and complex cases in Toronto are not getting the intensive intervention needed to prevent tragedy.
Conclusion: An Urgent Call for a Data-Driven Response
So, how safe is Toronto? The 2024-2025 data shows there is no simple answer. While public awareness appears to be growing, so does the demand on our emergency and social services. And while our overall per capita rates are not the highest in Ontario, the risk of lethal violence remains a significant and disproportionate threat.
These statistics are not just an annual report card; they are a call to action. They prove the urgent need for continued investment in data-driven policing, targeted resources for hotspot communities, and robust funding for the frontline community agencies that work to break the cycle of violence long before it becomes a 911 call.
FAQ
1. How safe is Toronto regarding domestic violence in 2024-2025?
While Toronto's per capita rate of police-reported intimate partner violence is 4% lower than the provincial average for large cities, the city still faces significant challenges. In 2024, Toronto accounted for nearly 30% of all domestic-related homicides in Ontario. Overall calls to police for domestic incidents have also risen by 9% in the past year, indicating an ongoing and serious issue.
2. Did the rate of domestic violence in Toronto increase this past year?
Yes, according to the data from July 2024 to July 2025, overall domestic-related calls for police service in Toronto increased by approximately 9%. The most significant increases (15%) were seen in calls classified as "Domestic Disputes," "Verbal Threats," and "Harassment," while reports of serious physical assault remained stable.
3. Which areas of Toronto have the highest increase in domestic violence reports?
The statistics show notable geographic disparities across the city. Police divisions covering north Etobicoke and eastern Scarborough experienced the most significant increases, with domestic incident reports rising by over 12% in the past 12 months.
4. How does Toronto's domestic violence rate compare to the rest of Ontario?
When adjusted for population, Toronto's per capita rate of police-reported intimate partner violence is actually 4% lower than the average for other large urban centres in Ontario. However, the city has a disproportionately high rate of domestic-related homicides, representing almost 30% of the provincial total in 2024.
5. What do the 2025 statistics show about repeat domestic violence incidents?
The data indicates a significant issue with recidivism. In the past year, 24% of all domestic-related police calls were to an address where police had previously been dispatched for a similar issue within the last 18 months, highlighting the cyclical nature of domestic abuse.
6. What types of domestic incidents have increased the most in Toronto?
The largest increase in police calls was for incidents that did not involve serious physical assault. Reports classified as "Domestic Disputes," "Verbal Threats," and "Harassment" collectively rose by 15% between July 2024 and July 2025. This suggests an increase in reported conflicts and coercive control behaviours.